Which US counties are alike?
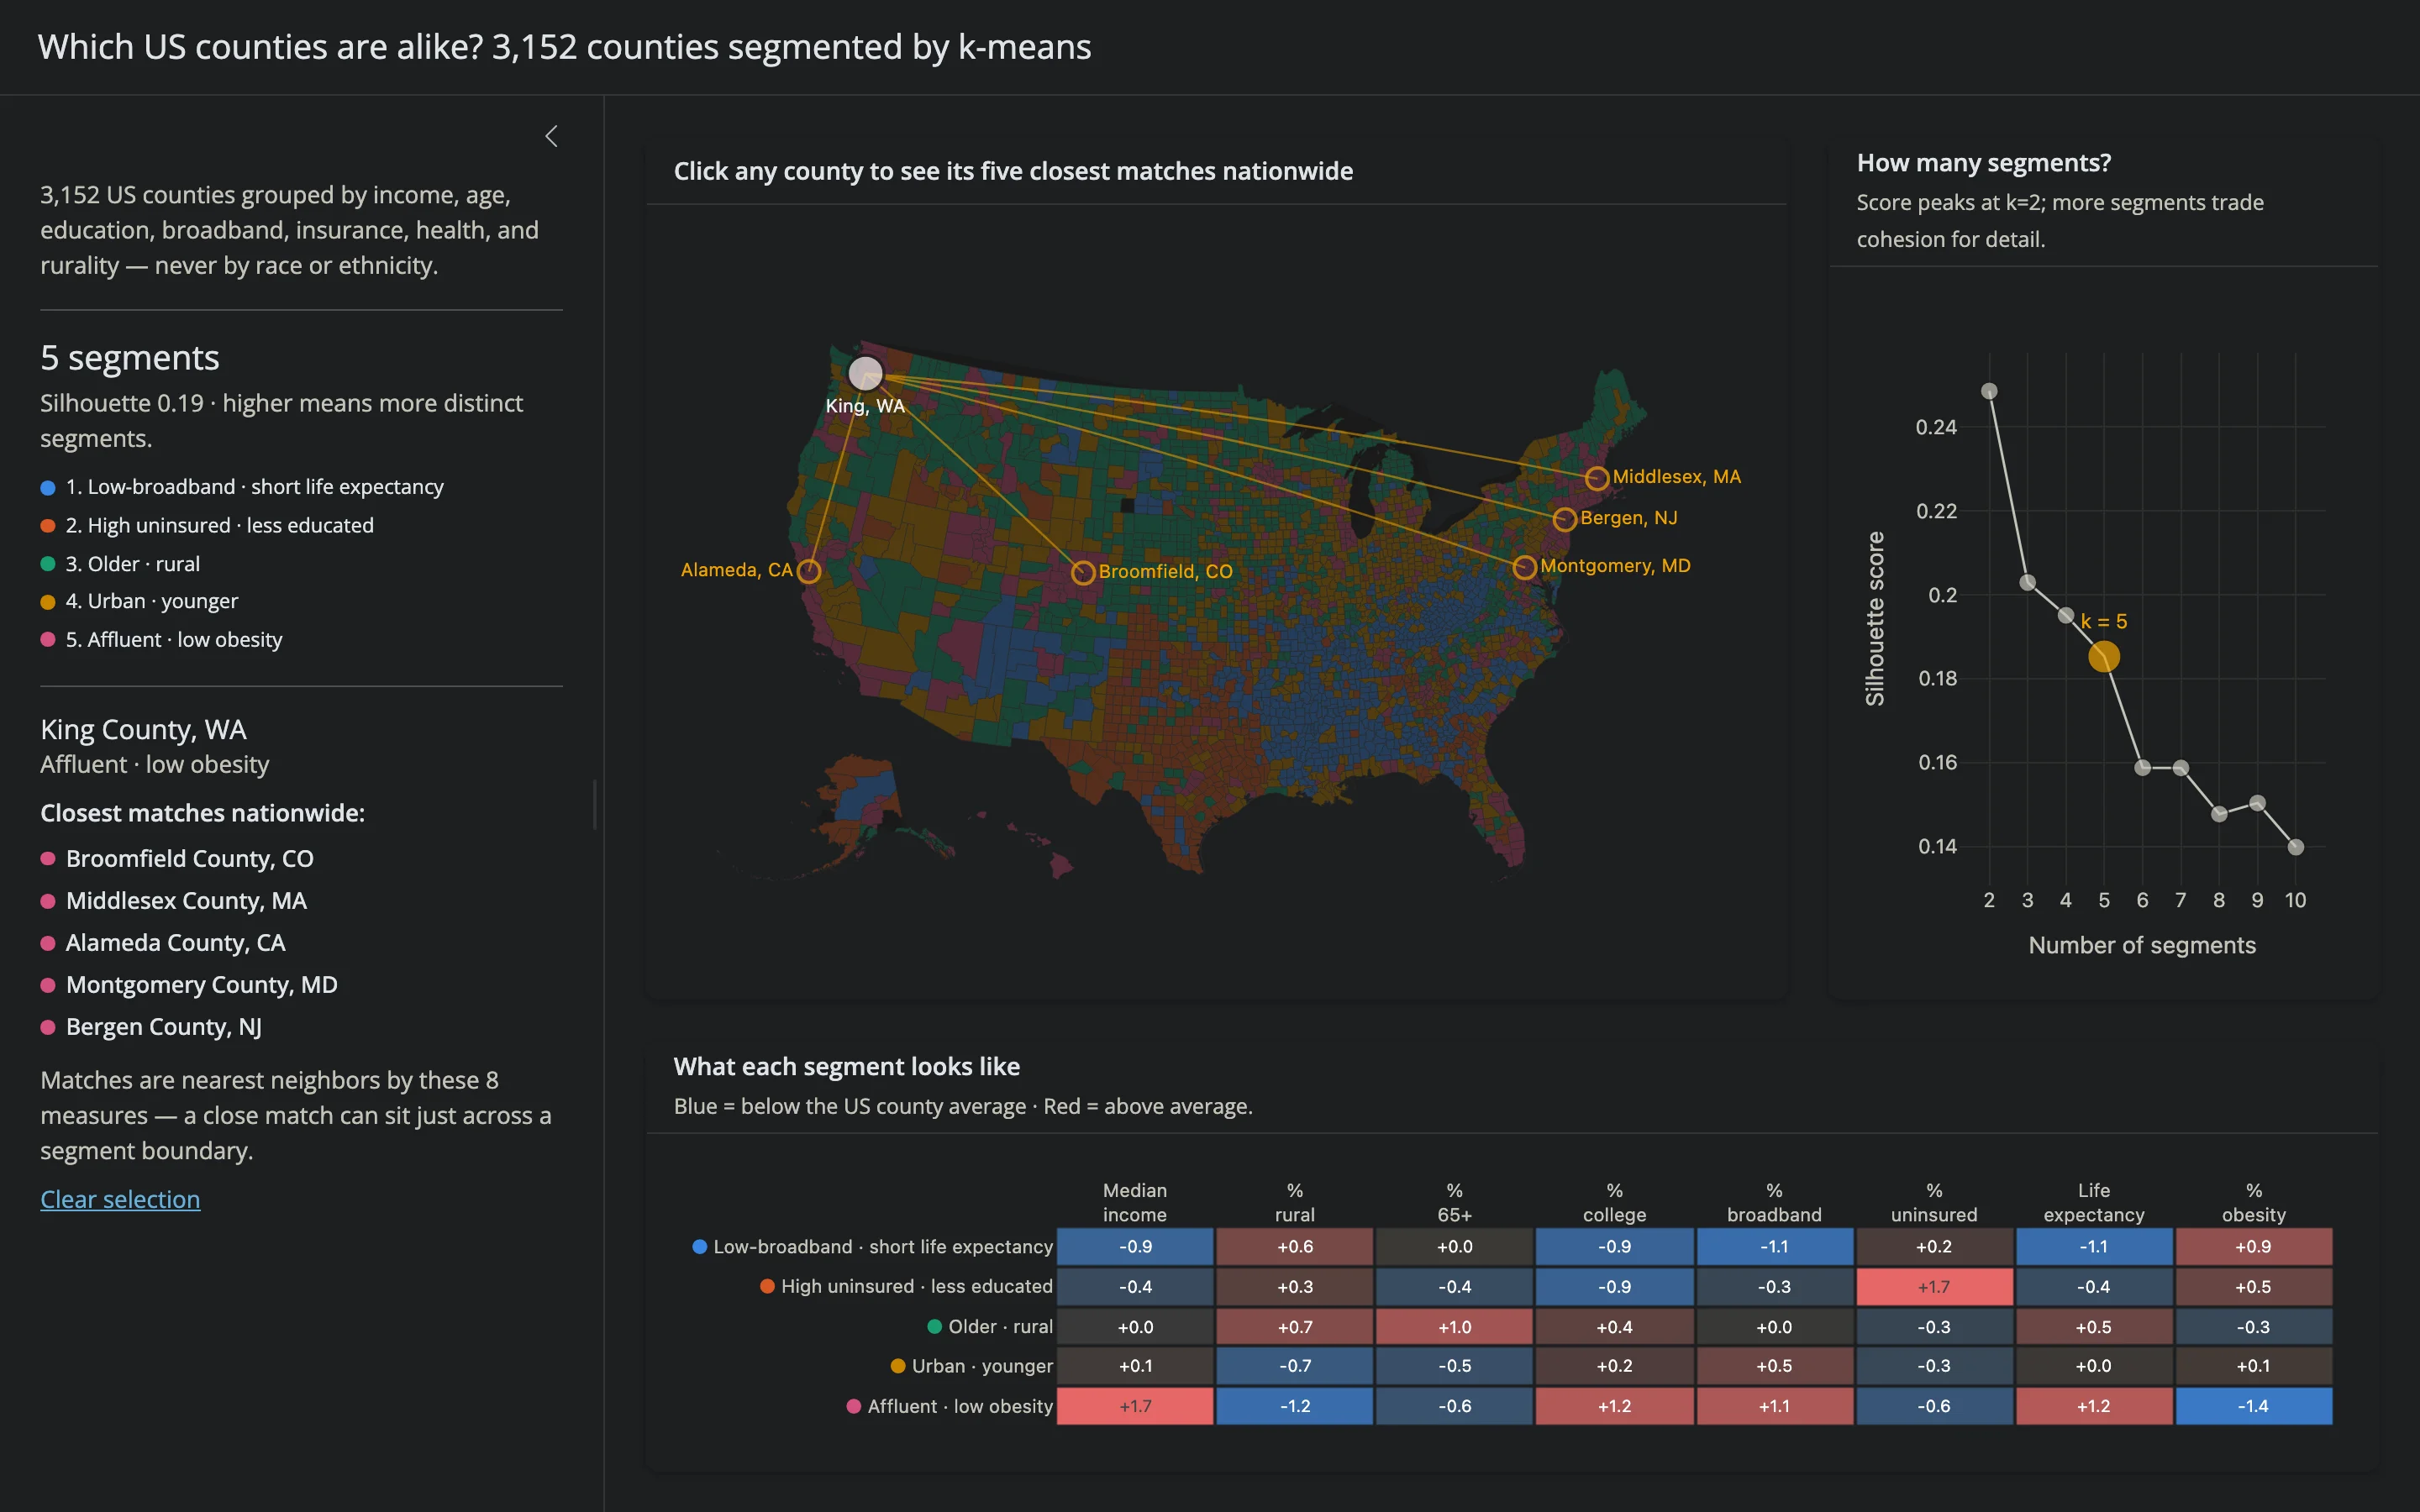
A model grouped 3,144 US counties into segments by income, age, education, broadband access, insurance coverage, health, and rurality — never by race or ethnicity. The silhouette-vs-k chart makes the k-means tradeoff visible instead of hidden behind a single “best” number: fewer, broader segments score higher, but more segments reveal finer structure, so the app starts at a readable 5 and lets you click any point from 2 to 10 to re-cluster live. Click any county on the choropleth and its five closest matches nationwide — nearest neighbors in standardized feature space, not geography — light up as rings and lines on a dimmed map and list in the sidebar, each labeled with the same plain-language segment name (“Rural · older”, “Affluent · low obesity”) that the profile heatmap explains.
Run it
git clone --depth 1 https://github.com/posit-dev/py-shinywidgets
cd py-shinywidgets/website/gallery/showcases/county-clusters
uv run --with scikit-learn shiny run app.py
data/counties.parquet is committed (prepared by prep_data.py from the County Health Rankings 2025 analytic file; see its imputation counts below). On first run the app downloads plotly’s public counties GeoJSON (~3 MB) and caches it under data/. That file predates some county-equivalent changes — Connecticut’s 2022 switch to planning regions, among others — so prep_data.py also commits current Census TIGER boundaries for the affected FIPS, which the app merges in.
Source: app.py
Try this
- Click a county. The map dims and a ring appears at each of its five closest matches nationwide (by these 8 measures, not geography), connected by a line back to the county you picked and labeled by name. A twin can be a thousand miles away — King County, WA (Seattle) turns out to be closest to Broomfield County, CO, with Bergen County, NJ not far behind. The sidebar lists the same five, with a reminder that a close match can sit on either side of a segment boundary.
- Click a point on the silhouette chart. The map recolors in place (no reset of your selection) and the profile heatmap and sidebar legend update to the new segment count. Re-click: a county’s twins stay the same — they don’t depend on k — but its segment label follows the new clustering.
- Read the profile heatmap. Each row is a segment’s z-score on every feature: strongly red means “much higher than the national average,” strongly blue means “much lower.” The two strongest traits become that segment’s name, and the row’s leading dot matches its color on the map and in the sidebar legend.
Accessors demonstrated
silhouette.clicked()reads the clicked point’sx(the k value) directly — nocustomdataneeded, since the x-axis is the thing being selected.map.clicked()readscustomdatainstead (the county’s FIPS code), filtered to the base choropleth trace (trace_index == 0) so a click that lands on a twin’s ring or connecting line doesn’t get mistaken for a new county.- The county choropleth is never fully re-rendered on a k change: a
reactive.effectmutates.widget.data[0](z-values, hover text, colorscale, and — while a county is selected — a dimmedmarker.opacity) insidewith w.batch_update():, so zoom and the twin markers survive. The profile heatmap takes the same approach, restylingz/y/textin place rather than rebuilding — both land in well under a second. - The selected county and its five twins share one
Scattergeotrace: each point’smarker.symbol/size/colorandtextpositionare plain Python lists (one entry per point, the selected county always first and largest), so a single.update()call repositions all six markers and their labels. A secondScattergeotrace draws the connecting lines, independent of the segment-recolor effect, so clicking a county and clicking a k point never race each other.
Verification
Driven end-to-end with Playwright in headless Chromium: clicking a silhouette point moved k from 5 to 6, recolored the map and reflowed the profile heatmap within ~1 s with no server error; clicking King County, WA selected it and its five closest matches (Broomfield County, CO; Middlesex County, MA; Alameda County, CA; Montgomery County, MD; Bergen County, NJ), dimming the base map and drawing a ring and a line to each, with all five listed in the sidebar; re-clicking a different k with that county still selected kept the same five twins while the segment label and map colors updated to the new clustering — confirming twins depend on feature-space distance, not on k. website/_tools/smoke.py passes with no server-log errors or page exceptions.